1

Estou tentando realizar o gráfico de resíduos do modelo de efeitos mistos por meio da função ggplot2. No entanto, após realizar uma busca encontrei algumas funções disponíveis mas o que me parece é que para a função nlme elas não estão funcionando.

Os gráficos que eu pretendo realizar são os do exemplo abaixo:

As rotinas computacionais que eu tentei inicialmente se encontram abaixo, vejam os erros que estão aparecendo ao executar a função em ggplot2.

library(splines)
library(ggplot2)
library(nlme)
library(gridExtra)

setwd("C:\\Users\\Desktop")
datanew1 = read.table("dadosnew.csv", header = T, sep=";", dec = ",")

datanew1$DummyVariable = as.factor(datanew1$DummyVariable)
datanew1$Variable2 = as.factor(datanew1$Variable2)
datanew1$Variable3 = as.factor(datanew1$Variable3)
#############################################################################
############################## Model ########################################
#############################################################################
model <-  lme(Response~(bs(Variable1, df=3)) + DummyVariable,
                         random=~1|Variable2/Variable3, datanew1, method="REML")
completemodel <- update(model, weights = varIdent(form=~1|DummyVariable))

p1 <- qplot(.fitted, .resid, data = completemodel) +
  geom_hline(yintercept = 0) +
  geom_smooth(se = FALSE)

Erro: `data` must be a data frame, or other object coercible by `fortify()`, not an S3 object with class lme
Run `rlang::last_error()` to see where the error occurred.
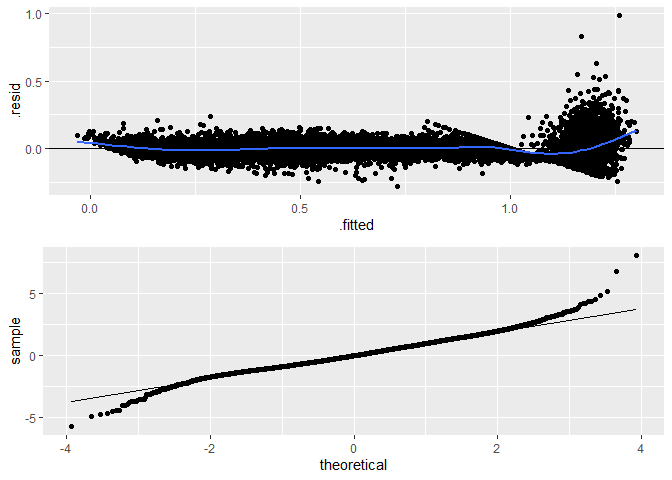
p2 <- qplot(sample =.stdresid, data = completemodel, stat = "qq") + geom_abline()
grid.arrange(p1,p2)

Erro: `data` must be a data frame, or other object coercible by `fortify()`, not an S3 object with class lme
Run `rlang::last_error()` to see where the error occurred.
Além disso: Warning message:
`stat` is deprecated 

Uma outra maneira na qual eu tentei realizar o gráfico foi com a função abaixo, mas não obtive sucesso.

ggplot(completemodel, aes(.fitted, .resid)) + geom_point()

Erro: `data` must be a data frame, or other object coercible by `fortify()`, not an S3 object with class lme
Run `rlang::last_error()` to see where the error occurred.

0

2 Respostas 2

3

Olha, pelos nomes (.fitted, .resid) os resultados parecem ser ligados ao pacote broom, que usa esse padrão pros nomes das colunas. (ou mais especificamente o broom.mixed para modelos lme)

Com a sintaxe de ggplot os gráficos ficariam assim

library(splines)
library(ggplot2)
library(nlme)
library(gridExtra)

datanew1 = read.table("E:/Downloads/dadosnew.csv", header = T, sep=";", dec = ",")

datanew1$DummyVariable = as.factor(datanew1$DummyVariable)
datanew1$Variable2 = as.factor(datanew1$Variable2)
datanew1$Variable3 = as.factor(datanew1$Variable3)


model <-  lme(Response~(bs(Variable1, df=3)) + DummyVariable,
              random=~1|Variable2/Variable3, datanew1, method="REML")
completemodel <- update(model, weights = varIdent(form=~1|DummyVariable))

df_model <- broom.mixed::augment(completemodel)
#> Registered S3 method overwritten by 'broom.mixed':
#>   method      from 
#>   tidy.gamlss broom
df_model[".stdresid"] <- resid(completemodel, type = "pearson")

p1 <- ggplot(df_model, aes(.fitted, .resid)) + 
  geom_point() +
  geom_hline(yintercept = 0) +
  geom_smooth(se=FALSE)

p2 <- ggplot(df_model, aes(sample = .stdresid)) +
  geom_qq() +
  geom_qq_line()

grid.arrange(p1,p2)
#> `geom_smooth()` using method = 'gam' and formula 'y ~ s(x, bs = "cs")'

Created on 2021-01-26 by the reprex package (v0.3.0)

Só o segundo que no seu exemplo seria com .stdred aí calculei com a função resid.

1
  • Muito obrigado pela solução @JorgeMendes!!
    – user55546
    Commented 26/01/2021 às 13:10
2

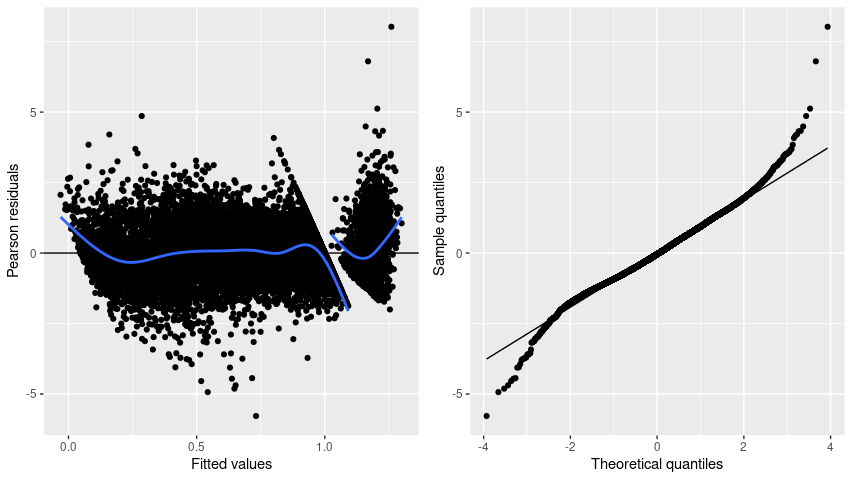
Como complemento à excelente resposta do Jorge Mendes, esta resposta separa os resíduos por níveis de DummyVariable no gráfico p1b. Isso é feito com o aes(group = DummyVariable).

O segundo gráfico, p2, é igual ao da resposta no link acima, com algumas preocupações estéticas. O código é essencialmente o mesmo, repetido só para ter ambos os gráficos lado a lado, tal como na pergunta.

E não precisa de criar um novo data.frame, usa o dplyr::mutate para obter os resíduos e os valores ajustados.

library(dplyr)
library(nlme)
library(splines)
library(ggplot2)
library(gridExtra)

p1b <- datanew1 %>%
  mutate(fitted = predict(completemodel),
         resid = residuals(completemodel, type = "pearson")) %>%
  ggplot(aes(fitted, resid)) +
  geom_point() +
  geom_hline(yintercept = 0) +
  geom_smooth(mapping = aes(group = DummyVariable), # separa as linhas
              formula = y ~ s(x, bs = "cs"),        # evita a mensagem quando
              method = "gam",                       # o gráfico é traçado
              se = FALSE,
              show.legend = FALSE) +
  labs(x = "Fitted values", y = "Pearson residuals")

p2 <- datanew1 %>%
  mutate(stdresid = residuals(completemodel, type = "normalized")) %>%
  ggplot(aes(sample = stdresid)) +
  geom_qq() +
  geom_qq_line() +
  labs(x = "Theoretical quantiles", y = "Sample quantiles")

grid.arrange(p1b, p2, ncol = 2)

inserir a descrição da imagem aqui

Dados

google_id <- "19mykz4B7jkTilbtwPQb3NUI09YZwohhs"
google_file <- sprintf("https://docs.google.com/uc?id=%s&export=download", google_id)
datanew1 <- read.csv2(google_file)

datanew1$DummyVariable <- factor(datanew1$DummyVariable)
datanew1$Variable2 <- factor(datanew1$Variable2)
datanew1$Variable3 <- factor(datanew1$Variable3)

model <-  lme(Response~(bs(Variable1, df=3)) + DummyVariable,
              random=~1|Variable2/Variable3, datanew1, method="REML")
completemodel <- update(model, weights = varIdent(form=~1|DummyVariable))
1
  • Muito obrigado pela solução @RuiBarradas!!
    – user55546
    Commented 26/01/2021 às 13:10

Você deve fazer log-in para responder a esta pergunta.

Esta não é a resposta que você está procurando? Pesquise outras perguntas com a tag .