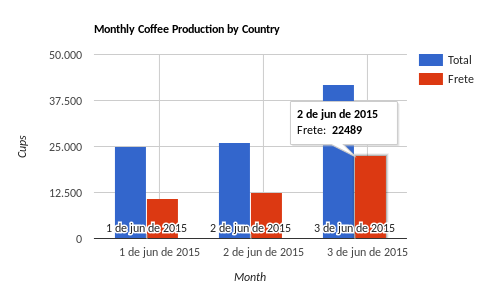
Estou desenvolvendo alguns teste com a API do google chart.
E estou tendo um problema um tanto peculiar.
Codigo
data = new google.visualization.DataTable();

data.addColumn({ type : 'date', label : 'Day' });
data.addColumn({ type : 'date', label : 'DayAnnotation', role : 'annotation' });
data.addColumn({ type : 'number', label : 'Total' });
data.addColumn({ type : 'number', label : 'Frete' });

data.addRow([ new Date('2015-06-01'), new Date('2015-06-01T23:00'), 24974.46, 10871 ]);
data.addRow([ new Date('2015-06-02'), new Date('2015-06-02T23:00'), 26075.61, 12485 ]);
data.addRow([ new Date('2015-06-03'), new Date('2015-06-03T23:00'), 41915.09, 22489 ]);

var options = {
    title : 'Monthly Coffee Production by Country',
    vAxis :  { title : 'Cups' },
    hAxis :  { title : 'Month' },
    seriesType : 'bars',
    series : { 5: { type : 'line' } },
    width : 500,
    height : 300,
};

chart = new google.visualization['ComboChart'](Element);
chart.draw(data, options);
Resultado

Como podem ver no eixo X ele exibe, correto a data informada, contudo no label esta sendo exibido 1dia retroativo.
Se notarem neste teste ainda tem a coluna com role : 'annotation', na qual eu tive de por as horas para se manter no dia do eixo X, se remover as horas ate mesma a annotation exibe retroativo.
Jsfiddle
Alguém sabe se deve ser feita alguma configuração para resolver isto?
Já fiz varias pesquisas e não achei algo a respeito.