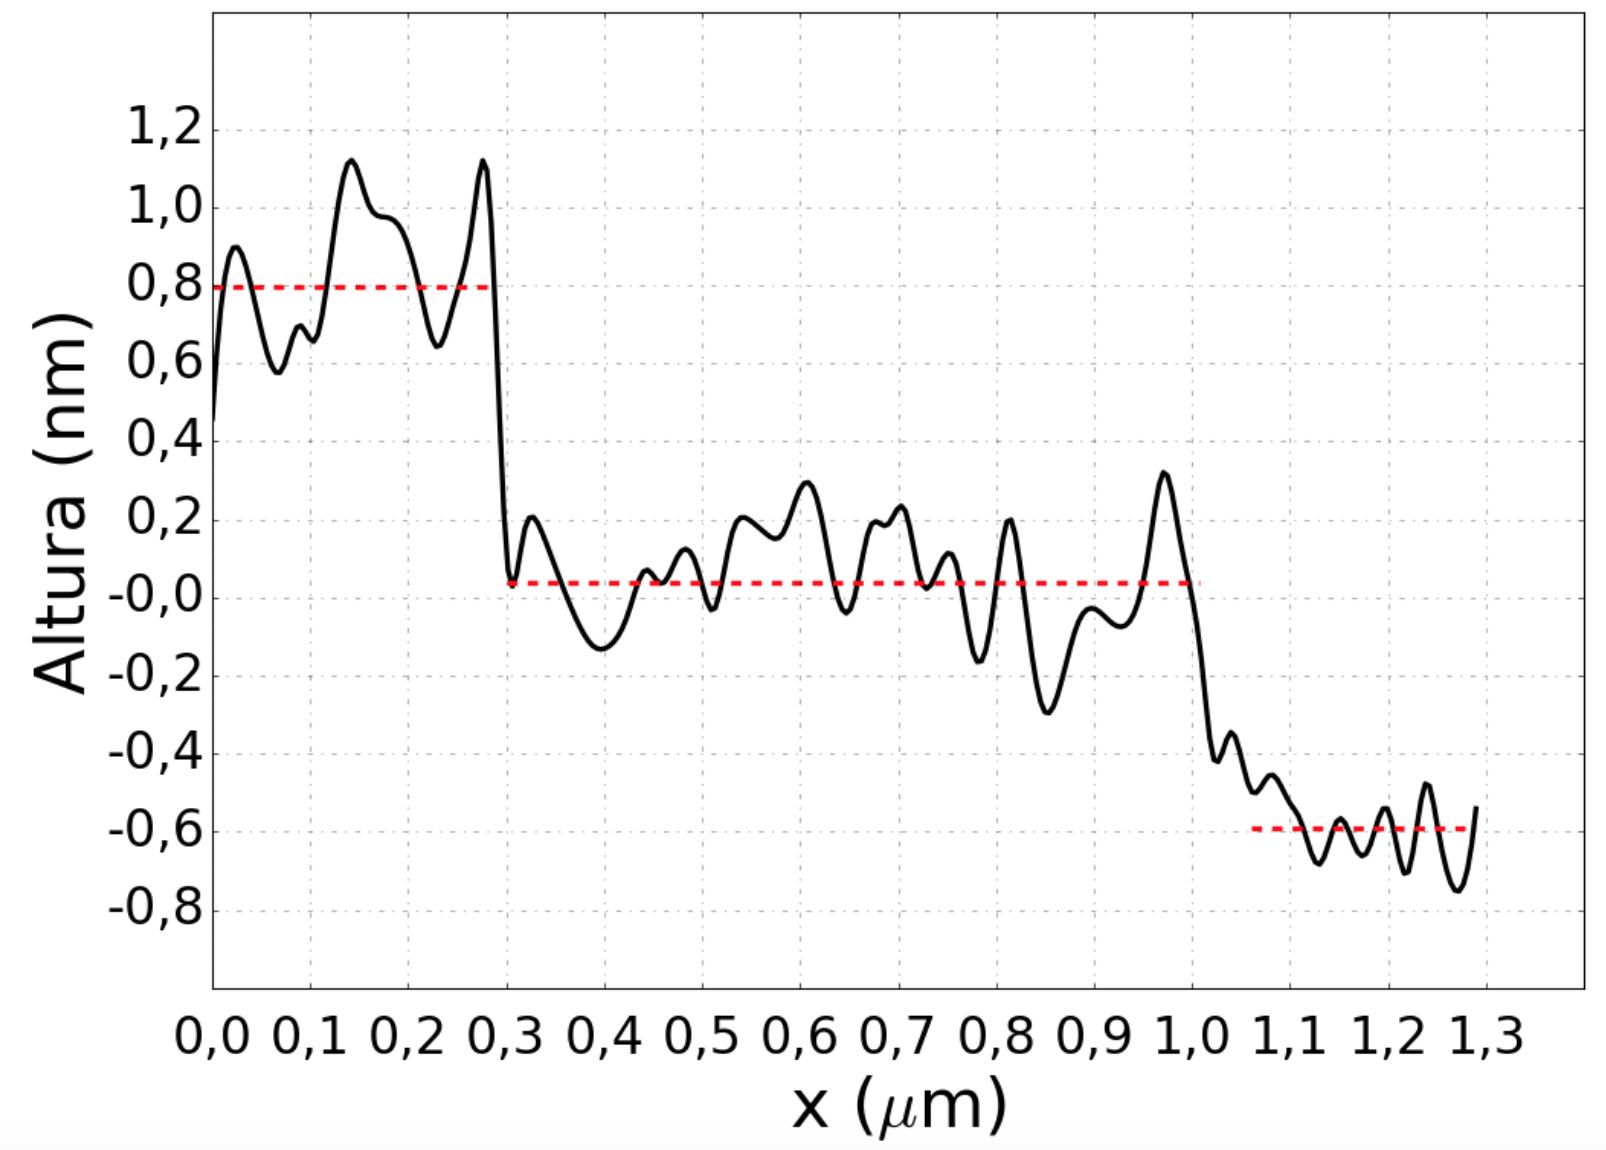
Eu estou a tentar retirar os quadrados brancos de um gráfico no Python (usando um Jupyter Notebook no Anaconda). Gostava que o eixo dos xx terminasse em 1,3 e que o eixo dos yy terminasse em 1,2. Tentei ajustar com algumas linhas de código mas fica sempre um espaço em branco à direita e em cima destes números, respetivamente. Como posso arranjar o código de forma a terminar nesses números, nos eixos?
#imagem2 amostra17 triangulo bicamada AFM com spline
import matplotlib.pyplot as plt
from numpy import *
import numpy as np
import pandas as pd
import time
import numpy as np
from scipy.interpolate import interp1d
from scipy.interpolate import make_interp_spline, BSpline

def func(x, pos):  # formatter function takes tick label and tick position
    s = str(x)
    ind = s.index('.')
    return s[:ind] + ',' + s[ind+1:]   # change dot to comma
x_format = tkr.FuncFormatter(func)
plt.rcParams["figure.figsize"] = [14.5,10]
fig, ax =plt.subplots()
ax.xaxis.set_major_formatter(x_format)
ax.yaxis.set_major_formatter(x_format)
x1=np.array([0.00E+00, 1.77E-02, 3.53E-02, 5.30E-02, 7.07E-02, 8.83E-02, 1.06E-01, 1.24E-01, 1.41E-01, 1.59E-01,
             1.77E-01, 1.94E-01, 2.12E-01, 2.30E-01, 2.47E-01, 2.65E-01, 2.83E-01, 3.00E-01, 3.18E-01, 3.36E-01,
             3.53E-01, 3.71E-01, 3.89E-01, 4.06E-01, 4.24E-01, 4.42E-01, 4.59E-01, 4.77E-01, 4.95E-01, 5.12E-01,
             5.30E-01, 5.48E-01, 5.65E-01, 5.83E-01, 6.01E-01, 6.18E-01, 6.36E-01, 6.54E-01, 6.71E-01, 6.89E-01,
             7.07E-01, 7.24E-01, 7.42E-01, 7.60E-01, 7.77E-01, 7.95E-01, 8.13E-01, 8.30E-01, 8.48E-01, 8.66E-01,
             8.83E-01, 9.01E-01, 9.18E-01, 9.36E-01, 9.54E-01, 9.71E-01, 9.89E-01, 1.01E+00, 1.02E+00, 1.04E+00,
             1.06E+00, 1.08E+00, 1.10E+00, 1.11E+00, 1.13E+00, 1.15E+00, 1.17E+00, 1.18E+00, 1.20E+00, 1.22E+00,
             1.24E+00, 1.25E+00, 1.27E+00, 1.29E+00])
y1=np.array([4.58E-01, 8.76E-01, 8.41E-01, 6.54E-01, 5.81E-01, 6.97E-01, 6.62E-01, 9.29E-01, 1.12E+00, 1.01E+00,
             9.74E-01, 9.38E-01, 7.89E-01, 6.41E-01, 7.56E-01, 9.48E-01, 1.03E+00, 1.24E-01, 1.64E-01, 1.70E-01,
             5.88E-02, -5.23E-02, -1.25E-01, -1.23E-01, -4.51E-02, 7.04E-02, 3.50E-02, 1.13E-01, 7.76E-02, -3.22E-02,
             1.59E-01, 1.99E-01, 1.64E-01, 1.66E-01, 2.82E-01, 2.46E-01, 2.22E-02, -1.33E-02, 1.78E-01, 1.85E-01,
             2.25E-01, 3.84E-02, 7.85E-02, 8.10E-02, -1.43E-01, -6.56E-02, 2.02E-01, -2.28E-02, -2.85E-01, -2.23E-01,
             -6.94E-02, -2.95E-02, -6.49E-02, -6.24E-02, 9.11E-02, 3.21E-01, 1.34E-01, -1.66E-01, -3.91E-01, -3.45E-01,
             -4.94E-01, -4.54E-01, -5.27E-01, -5.66E-01, -6.84E-01, -5.67E-01, -6.55E-01, -6.47E-01, -5.43E-01, -7.08E-01,
             -4.73E-01, -5.77E-01, -7.53E-01, -5.41E-01])

xnew = np.linspace(x1.min(), x1.max(), 300)
spl = make_interp_spline(x1, y1, k=3)
curva_smooth = spl(xnew)

plt.plot(xnew, curva_smooth, linestyle='-', linewidth=3, marker='None', color='Black')
df = pd.read_excel('AFMimagem2amostra17_triangulo_bicamada.xlsx', header=None, usecols=[0,1,2,3,4,5,6,7,8], names=['A', 'B', 'C', 'D','E','F','G','H'])
#ax.plot(df['A'], df['B'], label='T. "fria"=340 ºC', linestyle='None', linewidth=3, marker='None', color='Black', markersize=14)
ax.plot(df['C'], df['D'], label='_T. "fria"=340 ºC', linestyle='--', linewidth=3, marker='None', color='Red', markersize=14)
ax.plot(df['E'], df['F'], label='_T. "fria"=340 ºC', linestyle='--', linewidth=3, marker='None', color='Red', markersize=14)
ax.plot(df['G'], df['H'], label='_T. "fria"=340 ºC', linestyle='--', linewidth=3, marker='None', color='Red', markersize=14)
ax.yaxis.grid(b=True, color='black', alpha=0.3, linestyle='-.', linewidth=1)
ax.xaxis.grid(b=True, color='black', alpha=0.3, linestyle='-.', linewidth=1)
ax.set_xlabel('x ($\mu$m)', fontsize=40)
ax.tick_params(axis='x', pad=15)
plt.xticks(np.arange(0.0,1.4,0.1).round(decimals=1))
plt.yticks(np.arange(-0.8,1.3,0.2).round(decimals=1))
ax.set_ylabel('Altura (nm)', fontsize=40)
plt.rc('xtick', labelsize=30)
plt.rc('ytick', labelsize=30)
#ax.set_title('Perfil de temperatura do forno', fontsize=20)
#ax.legend(loc=9,
#          bbox_to_anchor=(.7,.97),
#          labelspacing=2.5,
#          numpoints=1,
#          columnspacing=0.5,
#          ncol=2, fontsize=15,
#          frameon=False)

#trans = ax.get_xaxis_transform() # x em unidades do dado, y em fração do eixo
#ann = ax.annotate('T$_\mathregular{Q}$', xy=(120, 0.5), xycoords=trans, fontsize=20)
#ann = ax.annotate('T$_\mathregular{F}$', xy=(120, 0.35), xycoords=trans, fontsize=20)
#ann = ax.annotate('T$_\mathregular{T}$', xy=(120, 0.25), xycoords=trans, fontsize=20)
#plt.show()
plt.savefig('output.png', dpi=500, bbox_inches='tight')
Ficheiro Excel 'AFMimagem2amostra17_triangulo_bicamada.xlsx' (não consegui colocar todos os números das primeiras colunas porque não cabiam na foto, mas encontram-se no código em Python):
Gráfico obtido no Python:

