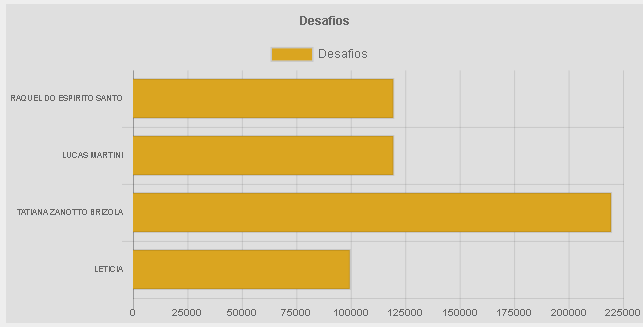
Como faço para que apareça valores ao lado das barras no gráfico?
var ctx = document.getElementById('desafios').getContext('2d');
			window.myHorizontalBar = new Chart(ctx, {
				type: 'horizontalBar',
				data: grafDesafios,
				options: {
					// Elements options apply to all of the options unless overridden in a dataset
					// In this case, we are setting the border of each horizontal bar to be 2px wide

                                        elements: {
						rectangle: {
							borderWidth: 2
						}
					},
					responsive: true,
					legend: {
                                            	display: true
					},
					title: {
						display: true,
						text: 'Desafios'
					},
                                        scales: {
                                            xAxes: [{
                                                ticks: {
                                                    suggestedMin: 0,
                                                    suggestedMax: 200000,
                                                    stepSize: 25000,
                                                    fontSize: 10
                                                }
                                            }],
                                            yAxes: [{
                                            ticks: {
                                                fontSize: 8
                                            }
                                        }]
                                        },
                                        animation: {
                                            animateRotate: true,
                                            animateScale: false,
                                            duration: 3000
                                        },
                          	}
			});
Obrigado.
