#---------------- Importações------------------------

!pip install cartopy
import xarray as xr
import matplotlib.pyplot as plt
import numpy as np
import cartopy.feature as cfeature
import cartopy.crs as ccrs
from cartopy.mpl.gridliner import LATITUDE_FORMATTER, LONGITUDE_FORMATTER
import matplotlib as mpl
from matplotlib.colors import LinearSegmentedColormap

#------------------------------------------------------
#----------------Leitura do Arquivo--------------------

ds = xr.open_dataset("/content/drive/MyDrive/ArquivoDeTeste.nc")
nome= "Arquivo de Teste"

#------------------------------------------------------
#--------------Criar Figura / plotar-------------------


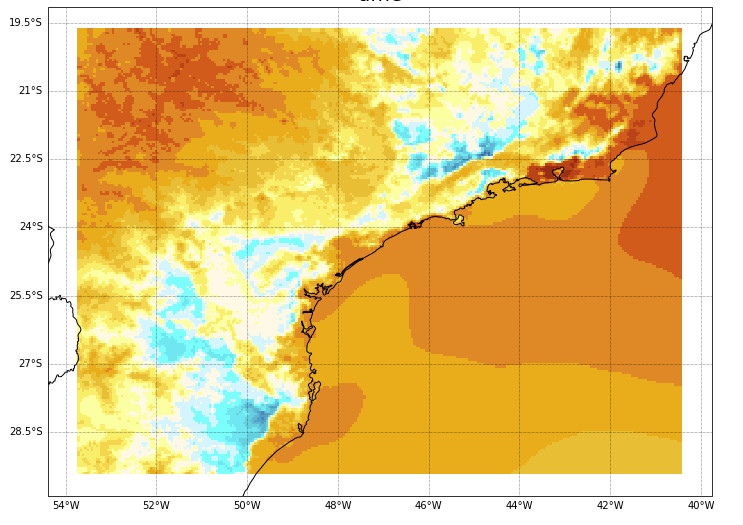
t=ds['temperatura']-273.15


fig = plt.figure(figsize=(12,12))

ax = fig.add_subplot(111, projection=ccrs.PlateCarree())

img=t.mean(dim='time').plot(cmap=cmap,add_colorbar=False)

ax.set_title(f'- {nome}\n{ds.isel(time=10, lat=0,lon=0).time.values}', fontsize=20)
#ax.set_extent([-20,-29,-54,-40])


#--------------------------------------------------------
#------------------Linhas e Contornos--------------------


gl = ax.gridlines(crs=ccrs.PlateCarree(), color='black', alpha=1.0, linestyle='dotted',
linewidth=0.50,  draw_labels=True)

gl.top_labels = False
gl.right_labels = False

gl.yformatter = LATITUDE_FORMATTER
gl.xformatter = LONGITUDE_FORMATTER

ax.add_feature(cfeature.COASTLINE)
ax.add_feature(cfeature.BORDERS)

#-------------------------------------------
Imagem segue em Anexo
#---------------- Importações------------------------

!pip install cartopy
import xarray as xr
import matplotlib.pyplot as plt
import numpy as np
import cartopy.feature as cfeature
import cartopy.crs as ccrs
from cartopy.mpl.gridliner import LATITUDE_FORMATTER, LONGITUDE_FORMATTER
import matplotlib as mpl
from matplotlib.colors import LinearSegmentedColormap

#------------------------------------------------------
#----------------Leitura do Arquivo--------------------

ds = xr.open_dataset("/content/drive/MyDrive/ArquivoDeTeste.nc")
nome= "Arquivo de Teste"

#------------------------------------------------------
#--------------Criar Figura / plotar-------------------


t=ds['temperatura']-273.15


fig = plt.figure(figsize=(12,12))

ax = fig.add_subplot(111, projection=ccrs.PlateCarree())

img=t.mean(dim='time').plot(cmap=cmap,add_colorbar=False)

ax.set_title(f'- {nome}\n{ds.isel(time=10, lat=0,lon=0).time.values}', fontsize=20)
#ax.set_extent([-20,-29,-54,-40])


#--------------------------------------------------------
#------------------Linhas e Contornos--------------------


gl = ax.gridlines(crs=ccrs.PlateCarree(), color='black', alpha=1.0, linestyle='dotted',
linewidth=0.50,  draw_labels=True)

gl.top_labels = False
gl.right_labels = False

gl.yformatter = LATITUDE_FORMATTER
gl.xformatter = LONGITUDE_FORMATTER

ax.add_feature(cfeature.COASTLINE)
ax.add_feature(cfeature.BORDERS)

#-------------------------------------------
Imagem segue em Anexo
