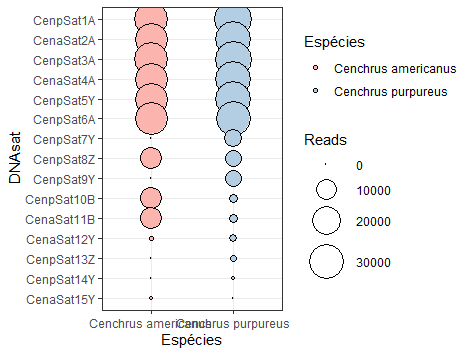
A função fct_inorder do forcats do tidyverse pode te ajudar
library(tidyverseforcats)
library(ggplot2)

dados <- structure(list(DNAsat = structure(c(9L, 4L, 10L, 5L, 11L, 12L,  13L, 14L, 15L, 6L, 1L, 2L, 7L, 8L, 3L, 9L, 4L, 10L, 5L, 11L,  12L, 13L, 14L, 15L, 6L, 1L, 2L, 7L, 8L, 3L), .Label = c("CenaSat11B",  "CenaSat12Y", "CenaSat15Y", "CenaSat2A", "CenaSat4A", "CenpSat10B",  "CenpSat13Z", "CenpSat14Y", "CenpSat1A", "CenpSat3A", "CenpSat5Y",  "CenpSat6A", "CenpSat7Y", "CenpSat8Z", "CenpSat9Y"), class = "factor"),  Espécies = structure(c(2L, 2L, 2L, 2L, 2L, 2L, 2L, 2L, 2L,  2L, 2L, 2L, 2L, 2L, 2L, 1L, 1L, 1L, 1L, 1L, 1L, 1L, 1L, 1L,  1L, 1L, 1L, 1L, 1L, 1L), .Label = c("Cenchrus americanus",  "Cenchrus purpureus"), class = "factor"), Reads = c(35629,  32123, 33698, 31857, 31812, 30664, 7534, 7128, 6395, 1887,  1865, 1435, 1069, 272, 18, 28201, 26867, 27799, 26206, 25967,  25987, 0, 11419, 0, 11879, 11887, 336, 0, 0, 220)), class = "data.frame", row.names = c(NA,  -30L))


dados2 <- dados %>%
  mutate(DNAsat = DNAsat %>% fct_inorder() %>% fct_rev())


ggplot(dados2dados,aes(x = Espécies, y = fct_rev(fct_inorder(DNAsat)), size = Reads,
                  fill=Espécies)) + geom_point(shape = 21) + theme_bw() +
  scale_fill_brewer(palette="Pastel1") + scale_size_area(max_size=13)
