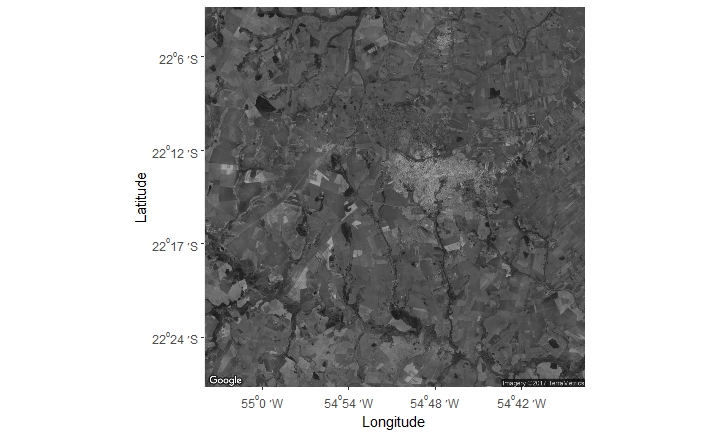
library(ggplot2)
library(ggmap)
library(GEOmap)

#get my map
city<- get_map(location = c(lon= -54.847, lat= -22.25),
               maptype = "satellite",zoom = 11,color="bw")

map<-ggmap(city,extent="normal")+
  xlab("Longitude")+ ylab("Latitude")

scale_x_longitude <- function(xmin=-180, xmax=180, step=1, ...) {
  xbreaks <- seq(xmin,xmax,step)
  xlabels <- unlist(
    lapply(xbreaks, function(x){
      ifelse(x < 0, parse(text=paste0(paste0(abs(dms(x)$d),"^{o}*"),
                               paste0(abs(dms(x)$m),expression(~minute)), "*W")),
             ifelse(x > 0, parse(text=paste0(paste0(abs(dms(x)$d),"^{o}*"),
                                             paste0(abs(dms(x)$m),expression(~minute)),"*E")),
                    abs(dms(x))))}))
  return(scale_x_continuous("Longitude", breaks = xbreaks, labels = xlabels, expand = c(0, 0), ...))
}

scale_y_latscale_y_latitude <- function(ymin=-90, ymax=90, step=0.5, ...) {
  ybreaks <- seq(ymin,ymax,step)
  ylabels <- unlist(
    lapply(ybreaks, function(x){
      ifelse(x < 0, parse(text=paste0(paste0(abs(dms(x)$d),"^{o}*"),
                                      paste0(abs(dms(x)$m),expression(~minute)), "*S")),
             ifelse(x > 0, parse(text=paste0(paste0(abs(dms(x)$d),"^{o}*"),
                                             paste0(abs(dms(x)$m),expression(~minute)),"*N")),
                    abs(dms(x))))}))
  return(scale_y_continuous("Latitude", breaks = ybreaks, labels = ylabels, expand = c(0, 0), ...))
}

map +
  scale_x_longitude(-55.0,-54.7,.1) +
  scale_y_latitude(-22.4,-22.1,.1)
Consegui adicionar os valores do minuto, mas não obtive sucesso com a inclusão do símbolo '
